
Narrative
What are the happiest & unhappiest countries/regions in the world?
To start off our narrative, we first thought of finding out what the happiest and unhappiest countries and regions are in the world from the data. The dataset includes responses from 153 countries and tracks Cantril Ladder scores, which reflect how people evaluate their lives overall.
On the map, in addition to the color scale, we can hover the cursor above each country to get their exact average score. While this map is valuable for seeing overall larger trends, we can also use bar charts to compare regions and the highest- and lowest-scoring countries more directly.
Overall, these bar plots are very telling. Firstly, the two regions with by far the highest average ladder score are Western Europe and North America/Australia and New Zealand. This lines up with how the top 15 countries are dominated by countries in those regions. The bottom 15 countries also reveal a striking pattern: it is predominantly made up of Sub-Saharan African countries, with them taking up 11 of the 15 spots. Two South Asian countries appear as well, and the region itself also has the second lowest average ladder score by region.
Overall, this opens the doors for many questions. In figure 3, all of the Nordic countries appear in the top 7, which as discussed in Martela’s The Nordic Exceptionalism: What Explains Why the Nordic Countries Are Constantly Among the Happiest in the World? appears due to “well-functioning democracy, generous and effective social welfare benefits, low levels of crime and corruption, and satisfied citizens who feel free and trust each other and governmental institutions” (Martela et al. 2020, 139).
This lines up with how the dataset utilizes explanatory variables, like perceptions of corruption and logged GDP per capita as mentioned earlier. While we can use the data to explore how these variables correlate to happiness on average, it also raises the question of whether they are enough to measure happiness on their own, and whether the dataset leaves out other important explanatory variables. We will explore those questions later.
What are the commonalities of the happiest & unhappiest countries?
As we continue exploring the global happiness levels, we wanted to see what exactly the happiest and unhappiest countries have in common. Rather than looking at each country individually, we compared the average values of these factors for the top 15 happiest countries and the bottom 15 unhappiest countries. The averages of these factors include GDP per capita, social support, healthy life expectancy, freedom to make life choices, generosity, and perceptions of corruption. As we end up comparing these averages, we can see which factors seem to be most closely connected to higher levels of happiness.
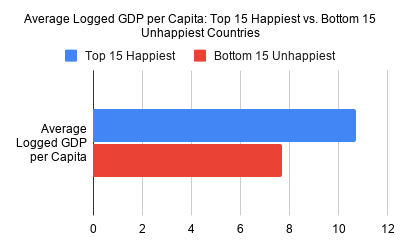
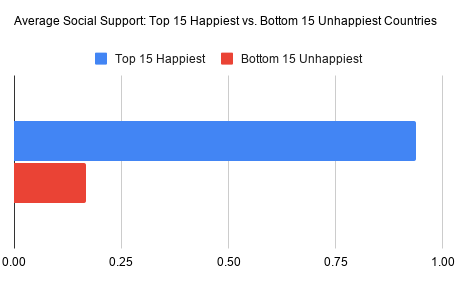
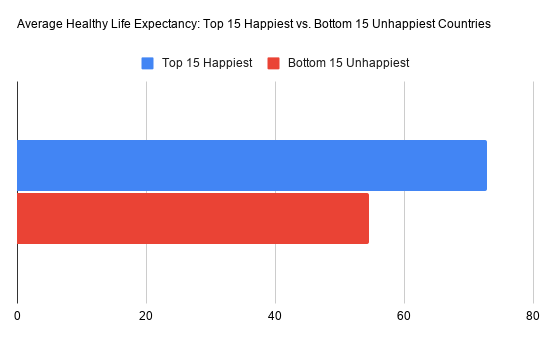
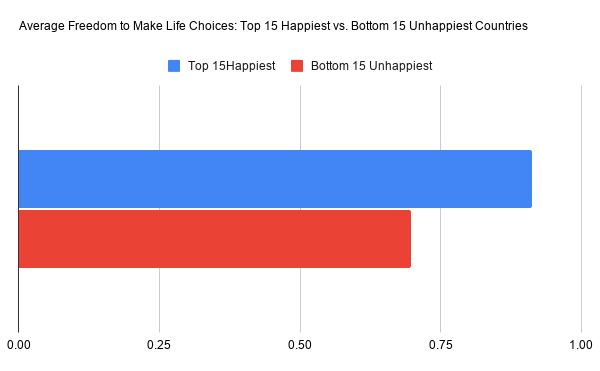
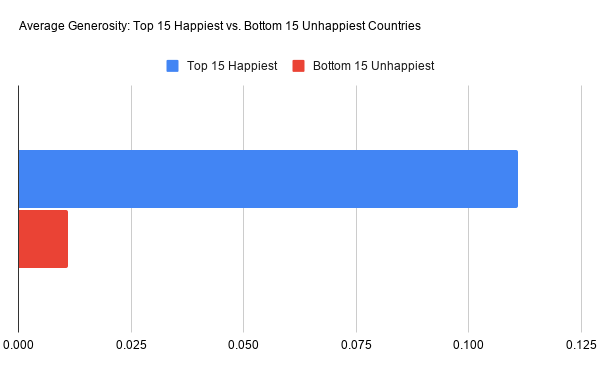
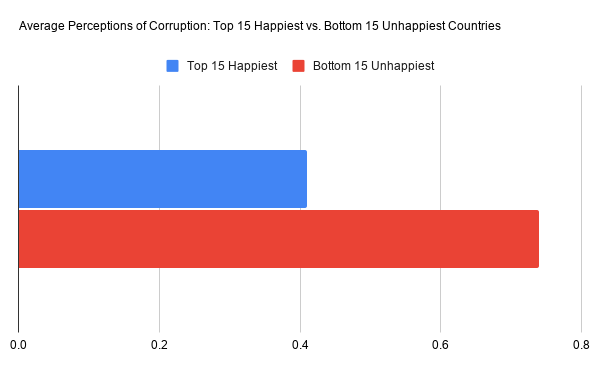
Overall, these comparisons show multiple clear patterns. The happiest countries report higher average logged GDP per capita, stronger social support, longer healthy life expectancy, and greater freedom to make life choices than the unhappiest countries. These findings suggest that countries with stronger economies, healthier populations, and better support systems tend to report higher levels of happiness. Generosity is also slightly higher among the happiest countries, although the difference is much smaller than the other variables, suggesting that generosity alone does not explain differences in happiness. These results are consistent with the findings of Jebb (2020), who argues that well being is influenced by multiple factors, including health, relationships, and economic conditions, rather than only being determined by a single variable.
The bar graphs show that happiness is connected to several factors. The happiest countries end up having a higher GDP, better health, stronger social support, and more freedom to make life choices. This suggests that these factors work together to influence overall happiness. One interesting result is the difference in perceptions of corruption. Unlike the other variables, it does not follow the same pattern, showing that some factors are more complicated to understand.
Overall, these visualizations support the idea that happiness is influenced by a mix of economic, social, and health related factors, not just income. While the graphs show clear differences between the happiest and unhappiest countries, they also suggest that other factors, such as culture, politics, or history, may also affect happiness. These are questions that could be explored more in our project.
What factors explain a country’s happiness the most?
The World Happiness Report lists 6 factors to explain a country’s happiness, however, they have varying levels of validity and correlation.
In this horizontal bar chart, the y-axis represents each of the 6 factors; the x-axis represents how each factor weighs in the total. Based on the figure above, average social support ratio ranks the most significant whereas average corruption ratio marks the least.
So why is this the case? When emotions fluctuate throughout someone’s day, which directly factors into one’s happiness, social support allows them to feel love and belonging. According to “Wealth and Happiness across the World: Material Prosperity Predicts Life Evaluation, Whereas Psychosocial Prosperity Predicts Positive Feeling.”, daily emotions affect social well being (SWB) the most, and these are controlled more by the overall prosperity of a society (“soceital income”). In reference to Maslow’s Hierarchy of Needs, once basic physiological and safety needs are met, the next step of gaining esteem is building social support.
Sure, corruption is the least significant factor, but is there a chance that countries perceive corruption inaccurately? The Boiling Frog Parable is the idea of how a frog would leave a pot of water if it is boiling already compared to if it was to be gradually heated. In “Analysis of the Impact of Corruption Perception on Subjective Wellbeing: Revisiting the Boiling Frog Parable from the World Happiness Report 2020.”, Pérez-Cárceles references this idea to relate how citizens of a country may have been used to pre-existing corruption to a point where they have been desensitized. Despite consistently ranking the least in the world, there is a chance that this variable’s rank is a false negative. Regardless, the World Happiness Report places it as such.
In this list of bar charts, the x-axis represents each of the 6 factors; the y-axis represents how each factor weighs in the total. Furthermore, each bar chart represents a world region—as seen above. Based on the figure above, average social support ratio continues to rank the most significant whereas average corruption ratio marks the least.
Throughout every world region, social support continues to rank the highest, while corruption remains the least—despite some exceptions. Using this information, the World Happiness Report 2020 provides helpful quantitative data for understanding how different objective factors can explain something subjective like happiness.
Are there any outliers? If so, what might explain this?
Are there countries that come out a lot happier or a lot less happy than the six factors say they should? And if there are, what could be causing that?
The report breaks each Ladder Score into six parts. Then it adds a baseline number of 1.97, and there is always some amount left over. That leftover is called the residual. If a country has a positive residual, it means it did better than the six parts predicted. We used that column to go find the outliers.
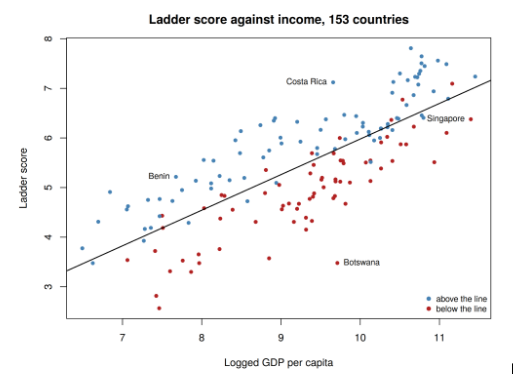
Benin has the biggest positive residual at plus 1.47. Botswana has the biggest negative one at minus 1.72. Both of them are in Sub-Saharan Africa, so it is not a regional thing. The average for that whole region is only 0.07. It is not about money either. We checked logged GDP against the residual, and it came out at negative 0.06, which is basically zero.
Singapore was the weirdest one. Its six parts add up to 5.44, and that is the highest out of all 153 countries. It also has the best healthy life expectancy in the data at 76.8 years and the lowest corruption score anywhere. So it should be right near the top, and it is not. It comes in 31st. Costa Rica only gets 4.17 on those same six parts, and it still ends up higher, 7.12 against Singapore’s 6.38.
What might explain them? The first guess was inequality, since Botswana has a Gini of 0.626 and Benin is only at 0.433. But that did not really work out. We got the Gini for twenty countries at both ends, and the correlation with the residual was only negative 0.18. Guatemala has a pretty high Gini and a big positive residual, so it goes both ways.
Easterlin and his coauthors have another idea, which is that money and wellbeing go together at first and then come apart later on. That would make sense for Singapore since the money there is fairly new. The best answer we found was in the OECD paper by Exton and her coauthors. They looked at this same leftover and said culture is worth about 20 percent of the variation that the objective stuff cannot explain. Basically, people do not all read a 0 to 10 scale the same way.
What can’t it tell us? The residuals add up to zero across all 153 countries, and that is just how the model was built, so a gap is only telling you how a country did next to the world average. The column is also picking up survey error and translation. Singapore got interviewed in English and Chinese, and Costa Rica in Spanish, and we have no way of telling that apart from a real difference. The name is a bit loaded too. Calling it a Dystopia residual makes anything outside the six variables sound like a problem, when some of it could just be stuff the report did not ask about.
What does happiness mean? What would happen if the query changed?
After identifying the countries and regions with the highest and lowest scores, as well as the factors that appear to explain those scores, it is important to consider what the dataset actually means when it comes to the term “happiness.” Despite its name, the World Happiness Report does not directly ask respondents how frequently they feel joyful or emotionally positive. Instead, its main score comes from the Cantril Ladder, which asks people to imagine a ladder ranging from zero, which represents the worst possible for them, to ten, which represents the best possible life. The respondents then select the step that best represents their current life. Therefore, the dataset primarily measures life evaluation, or how people judge the overall quality of their lives, rather than a complete measure of happiness.
This distinction matters because evaluating life positively is not exactly the same as believing that life has meaning or purpose. Research has found that income and material prosperity share a stronger connection to how people evaluate their lives, while positive feelings are more closely related to psychological and social conditions, such as autonomy and having people to depend on (Diener et al. 52-53). Kahneman and Deaton similarly found that income had a stronger relationship with life evaluation than with daily emotional well-being, which was more affected by experiences such as loneliness or poor health (Kahneman and Deaton 16489-90). This means that the World Happiness Report captures an important part of well-being, but the term “happiness” may make its measurement appear broader than it actually is.
The answers would likely differ if respondents were asked whether their lives had meaning or purpose. Someone facing financial stress or difficult living conditions might give their current life a low ladder score while still finding deep meaning through family, religion, community involvement, or personal responsibility. The opposite could also occur: a person may have financial security and personal freedom while still feeling that life lacks direction. Oishi and Westgate argue that happiness and meaning represent different versions of a good life. Happiness emphasizes comfort and positive experiences, while meaning is connected to purpose and contributing to something beyond oneself. (Oishi and Westgate 790-92).

Changing the wording could also affect comparisons between countries because cultures do not always define a good life in the same way. Some societies may emphasize independence and personal achievement, while others may place a greater value on family obligations or belonging within your community. Culture can influence both how people experience well-being and how they interpret international survey questions (Exton, Smith, Vandendriessche 5). Therefore, a question focused on meaning or purpose could produce different responses and possibly a different ordering of countries.
Ultimately, the World Happiness Report should be understood as measuring one important dimension of well-being instead of every aspect of a good life. Its rankings demonstrate how positively people evaluate their current circumstances, but they do not directly show whether people experience the greatest sense of purpose or the most meaningful lives. A purpose-based question would likely produce different results because it would direct attention towards more personal factors, such as family, identity, religion, responsibility, and long-term goals. This reveals that conclusions about global happiness depend partly on how researchers define happiness and which dimensions of well-being their questions make visible.
What’s left out of the dataset that could explain happiness?
Although the variables included in the happiness measurement reveal important patterns, they do not provide a complete explanation of well-being.

Figure 6.1 shows a clear positive relationship between logged GDP per capita and Ladder Score. However, countries with similar levels of economic development can still report substantially different happiness outcomes. Among the ten highest-GDP non-Nordic economies, Ladder Scores range from approximately 5.51 in Hong Kong to 7.56 in Switzerland. Singapore also has one of the highest GDP values in the dataset but a Ladder Score of only 6.38. In comparison, Finland has a lower logged GDP per capita than Singapore but the dataset’s highest Ladder Score, at 7.81. The Nordic countries generally appear above the overall trend line, suggesting that income alone cannot explain their high levels of life satisfaction.
Martela et al. argue that Nordic happiness is also supported by high-quality public institutions, effective welfare benefits, social cohesion, and trust in both other people and government. Social support and perceptions of corruption capture only part of this environment. They do not fully measure government effectiveness, democratic participation, the accessibility of public services, generalized trust, or the economic security created by welfare systems. The dataset also emphasizes national averages, leaving out whether happiness is distributed equally among different social and economic groups.
Language and culture introduce another limitation. The dataset records the languages used during Gallup interviews, allowing us to examine possible patterns between interview language and Ladder Score.

Figure 6.2 maps national Ladder Scores and allows countries to be filtered by predominant language group. Some countries classified within the same language group appear to have similar scores, but these patterns overlap strongly with geography. English-speaking countries such as Canada, the United States, Australia, and New Zealand generally display relatively high scores, while Spanish-speaking countries form a visible cluster in Latin America. However, differences also remain within language groups, and multilingual countries cannot always be represented by one category. The map therefore demonstrates a possible association rather than showing that language directly causes happiness.
More importantly, recording interview language does not reveal whether respondents interpret happiness questions in equivalent ways. Wierzbicka argues that words translated as “happy” can express different levels or types of positive feeling across languages. Cultural norms may also influence whether respondents express satisfaction enthusiastically or answer more modestly. Exton, Smith, and Vandendriessche similarly distinguish between cultural bias in survey responses and culture’s genuine influence on people’s experiences. They estimate that culture may explain approximately 20 percent of country-specific variation left unexplained by basic life circumstances, although objective conditions remain more influential overall.
The dataset is therefore a useful but partial representation of well-being. Institutional quality, social trust, welfare security, inequality, and cultural-linguistic differences may all influence either how happiness is experienced or how it is reported through a numerical scale.